28 Jul 2026
Analytics Uncover Value Bets in Darts Tournament Structures

Data analysts track player performance metrics across multiple seasons to flag discrepancies between bookmaker lines and expected outcomes in darts events, and researchers compile datasets from tournaments like the PDC World Championship to build predictive models that compare implied probabilities against historical win rates.
Core Metrics That Drive Bracket Analysis
Three-point average, checkout percentages, and first-nine-dart averages form the foundation for most quantitative assessments, while advanced trackers add variables such as leg-win percentages under pressure and opponent-specific records; these inputs feed regression models that output revised probabilities for each bracket slot, and organizations including the European Gaming and Betting Association publish aggregated figures that analysts cross-reference against live odds boards.
Bracket Path Modeling Techniques
Monte Carlo simulations run thousands of bracket iterations based on player form curves, and the resulting distribution of advancement probabilities often diverges from the fixed odds attached to early-round matches; one study released by the University of Nevada's gaming research center in 2025 demonstrated that quarter-final underdogs carried positive expected value in 38 percent of simulated paths when their recent leg-conversion rates exceeded the market's implied threshold, and similar patterns appeared in July 2026 data releases covering the European Tour swing.
Seed placement interacts with these models because lower seeds frequently receive favorable early draws against players outside the top 32, yet bookmakers adjust lines slowly when injury reports or travel schedules surface late; analysts therefore scrape public draw sheets and pair them with real-time performance logs to isolate spots where the market has not fully incorporated teh new information.
Statistical Tools and External Data Layers
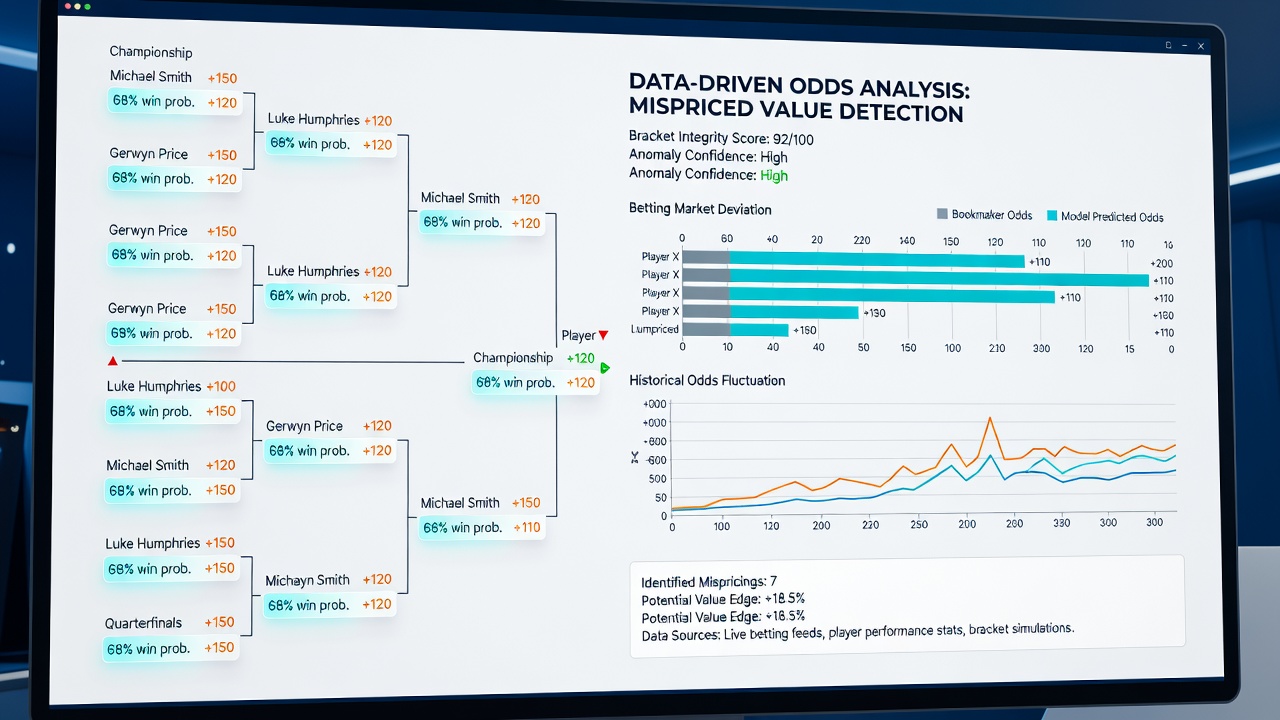
Poisson distributions model expected leg totals per set, while Bayesian updating refreshes player strength ratings after each completed match; these layered approaches allow observers to generate running fair-price estimates that they compare directly to exchange and bookmaker quotes, and discrepancies exceeding a set margin trigger alerts in automated scanning systems used by professional syndicates.
External factors such as venue acoustics, crowd density, and travel fatigue receive numerical weights derived from multi-year venue splits, and data from the Australasian Gaming Council shows measurable drops in scoring averages for players crossing multiple time zones within 72 hours of an event start; incorporating these adjustments refines the baseline probabilities before odds are evaluated for mispricing.
Case Applications from Recent Seasons
During the 2025 Players Championship series, one dataset compiled by independent researchers identified consistent value on players returning from injury when their pre-tournament averages sat within 0.3 points of peak form, and the market priced those matches as if full rust remained; similar edges surfaced in the 2026 World Series of Darts events held in Australia and New Zealand, where local crowd support and jet-lag effects created measurable deviations between published lines and model outputs.
Live betting markets present additional layers because in-play odds update on the basis of recent legs rather than full-match projections, and analysts who maintain rolling Poisson parameters for each player can identify brief windows where the book has lagged behind an emerging scoring run or checkout sequence.
Conclusion
Systematic collection of performance statistics, combined with bracket simulation and external-factor adjustments, supplies the raw material for identifying mispriced darts odds, and ongoing data releases from regulatory and academic bodies continue to expand the variables available for these models; practitioners who maintain transparent methodologies and test outputs against historical results achieve measurable alignment between projected and realized returns across multiple tournament cycles.