Finding Edges in Volleyball Handicaps: Micro-Form Analysis for Lower Division Leagues
Lower division volleyball leagues across Europe and beyond generate steady volumes of matches each season, yet the betting markets attached to them often receive less scrutiny than top flight contests. Observers note that handicap lines in these fixtures can shift noticeably when analysts track micro-form indicators such as set-by-set point differentials, serve reception efficiency, and substitution patterns. Data collected from several national federations shows these small performance markers tend to repeat across consecutive weekends, creating measurable edges when compared against bookmaker spreads.
Defining Micro-Form Indicators
Traditional form guides rely on win-loss records or overall set percentages, but micro-form drills deeper into granular statistics that surface between matches. Researchers tracking second-division Italian and Polish leagues have recorded how a team's reception success rate in the final five points of each set predicts handicap outcomes more reliably than season-long averages. Those who've compiled multi-week datasets find that squads maintaining above 62 percent positive reception in closing sequences cover Asian handicap lines at a higher clip than broader metrics suggest. The same studies highlight rotation fatigue, where middle blockers log fewer than 70 percent of possible points in back-to-back fixtures, often leading to inflated spreads that multiple bookmakers fail to adjust uniformly.
Collecting and Organizing Match Data
Analysts gather information from official score sheets published by domestic leagues together with video timestamps supplied by clubs or streaming services. One consistent approach involves logging every serve reception outcome, block touch, and substitution minute into a shared spreadsheet that updates after each round. European Volleyball Confederation reports indicate that lower leagues now provide digital match files within 48 hours, allowing quicker comparison across bookmakers operating in different jurisdictions. Observers who maintain rolling four-week windows discover that reception efficiency drops of three percentage points or more frequently precede handicap underperformance, while stable or improving figures align with overs in total points markets.
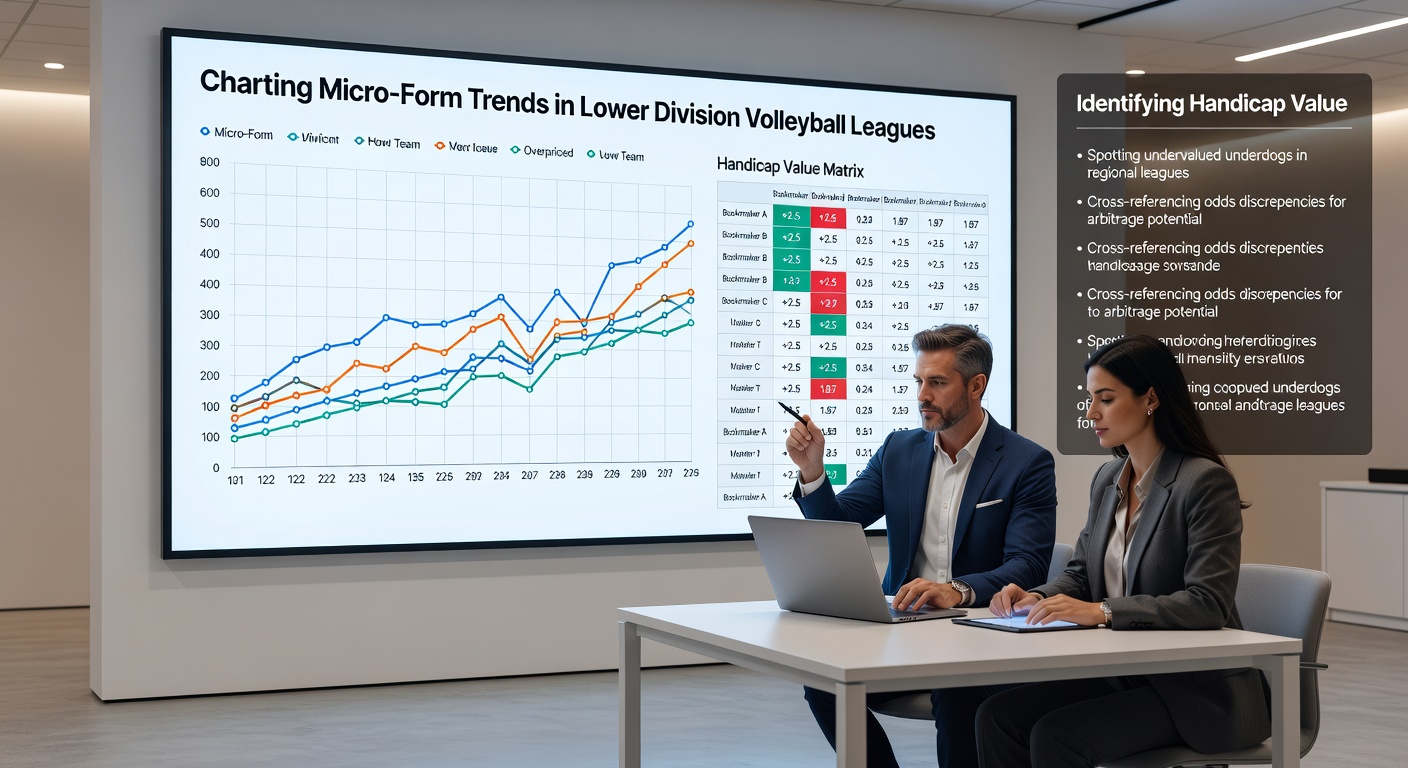
Mapping Trends to Handicap Markets
Once micro-form numbers are assembled, the next step requires aligning them with handicap offerings from several platforms. Bookmakers adjust lines at different speeds; some recalibrate spreads after every round while others wait for larger sample sizes. Figures from recent campaigns reveal that a 1.5-point gap in average closing-set margins between two teams often translates into a reliable half-set edge when the favorite sits at minus 3.5 or minus 4.5 on one site yet minus 2.5 on another. Cross-referencing these discrepancies lets bettors identify where the tightest prices sit relative to the underlying performance data.

Take one research group that followed the French Pro B league throughout the 2025-26 season. They recorded reception and attack efficiency for every team after each matchday, then compared those readings against handicap results offered by operators licensed in Malta, Curacao, and Australia. The compiled numbers showed that squads improving their positive reception rate by at least four points week-over-week covered the adjusted handicap at 58 percent frequency, while teams showing flat or declining numbers fell short of the line more often. Because the Australian-licensed books updated spreads slower than their Maltese counterparts, the same micro-form signal produced different values depending on the platform consulted.
Accounting for External Variables
Travel distance, back-to-back scheduling, and coaching changes also influence micro-form readings. Data compiled by the Canadian Volleyball Association notes that teams crossing more than 800 kilometers between fixtures experience measurable dips in serve reception during the opening set. Those patterns appear consistently enough that handicap markets sometimes lag behind the expected adjustment, especially when one bookmaker prices the match before travel data becomes public. Observers who layer these external factors onto their core indicators obtain clearer separation between value and overpriced lines.
Comparing Multiple Bookmaker Responses
Lines from different operators rarely move in lockstep. A platform focused on Asian markets may shade spreads more aggressively after a strong micro-form week, whereas European books retain wider margins until larger samples accumulate. Recent league summaries indicate the largest price gaps appear in mid-week fixtures where information flow slows. Bettors monitoring four or five platforms simultaneously can therefore isolate the most favorable handicap without relying on any single source. The process requires updating the same micro-form spreadsheet each round and feeding the latest reception and rotation figures into a simple comparison table that highlights outliers.
Conclusion
Lower division volleyball produces repeatable micro-form signals that translate into handicap value when tracked systematically. Reception efficiency shifts, rotation fatigue, and travel effects all surface in official match files now available faster than in previous seasons. By aligning these indicators with spreads across several bookmakers, analysts identify pricing inconsistencies that persist long enough to be acted upon. Continued collection of granular statistics through the remainder of the 2025-26 campaign and into May 2026 should further clarify which markers maintain predictive strength across varying schedule densities and roster changes.