12 Jun 2026
The Unseen Influence of Public Transport Disruptions on Regional Casino Attendance Patterns During Peak Holiday Seasons
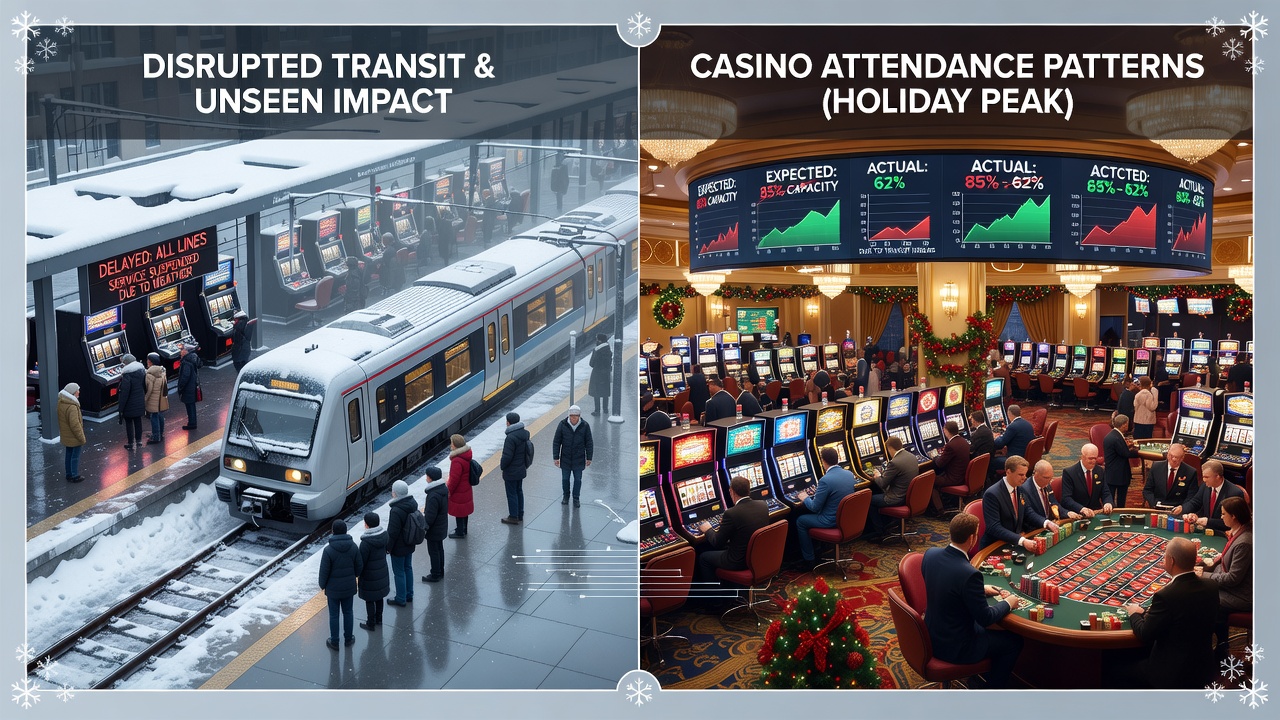
Public transport disruptions create ripple effects across regional economies, and casino venues often register those shifts through attendance records that align with holiday travel peaks. Data from transport authorities in multiple countries show how rail delays, bus route cancellations, and airport ground access issues coincide with measurable drops in visitor numbers at gaming facilities located outside major urban centers.
Patterns Across Holiday Windows
Peak seasons such as Christmas, New Year, and summer festivals bring concentrated travel demand, yet service interruptions during these periods frequently reduce the number of patrons reaching casinos that depend on intercity rail and coach connections. Studies conducted by researchers at the University of Melbourne have tracked attendance alongside transport performance metrics, revealing consistent correlations between service reliability scores and daily footfall at properties in Victoria and New South Wales.
Figures compiled by Australia's Bureau of Infrastructure and Transport Research Economics indicate that holiday rail punctuality below 85 percent correlates with attendance reductions ranging from 12 to 19 percent at regional venues situated more than 80 kilometers from capital cities. These patterns emerge because many patrons rely on scheduled services rather than private vehicles, especially during periods when fuel prices and parking constraints rise.
Regional Examples and Data Points
One documented case occurred in the Canadian province of Ontario during the December 2025 holiday window, when Via Rail corridor disruptions between Toronto and Niagara Falls coincided with a 14 percent decline in daily admissions at several casino properties in the Niagara region. Transport Canada records show that affected routes operated at 67 percent on-time performance for nine consecutive days, while parallel highway traffic volumes increased without fully offsetting the lost rail arrivals.
Similar observations appear in European data. The European Commission's Directorate-General for Mobility and Transport reported that disruptions on high-speed lines serving resort areas in Spain and Portugal during the 2025 summer period aligned with reduced visitor counts at gaming establishments in Alicante and Faro. Attendance tracking from industry associations noted that properties accessible primarily by rail experienced steeper declines than those served by direct motorway exits.
June 2026 Developments
Scheduled network upgrades and maintenance windows planned for June 2026 across several European rail corridors are projected to create additional pressure points during early summer travel. The International Union of Railways has published preliminary timetables indicating partial line closures on routes linking major airports to coastal gaming destinations, which could affect arrival patterns at venues in France and Italy. Operators in those markets have begun reviewing historical attendance datasets to model potential shortfalls should service frequencies drop below normal levels.
Measurement Approaches and Supporting Research
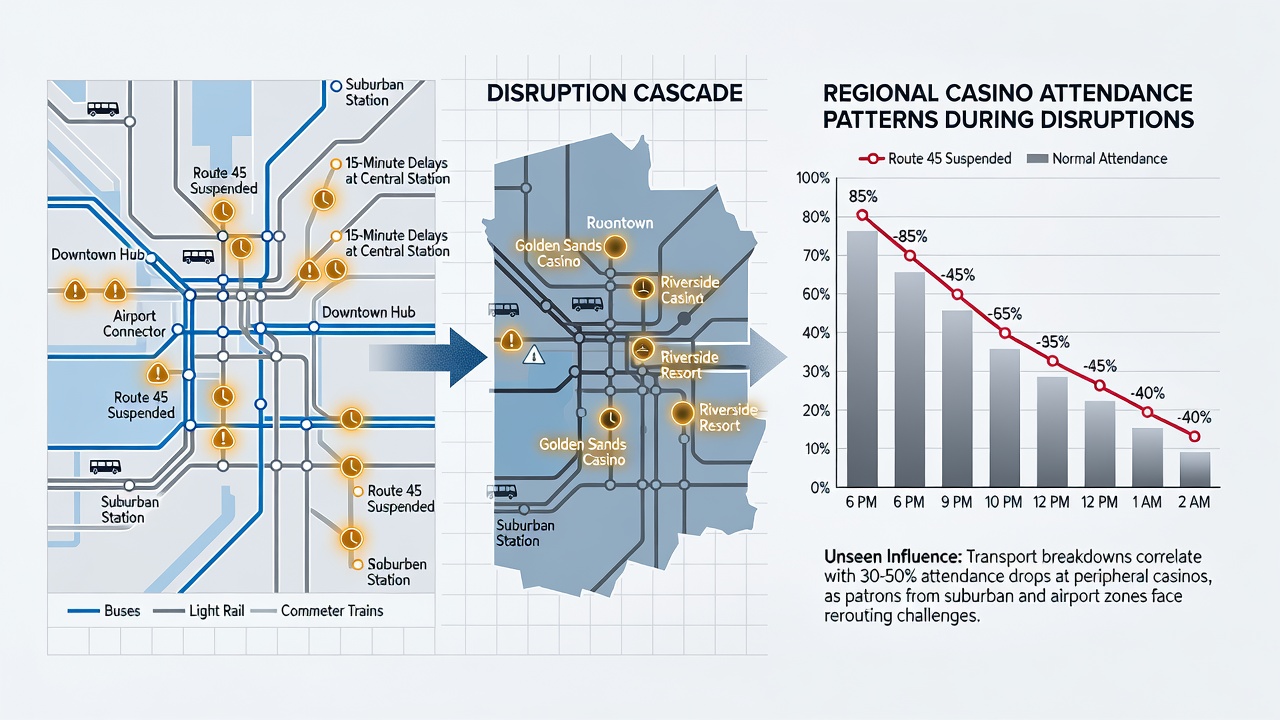
Analysts combine multiple data streams to quantify these influences. Ticket sales from transport operators, anonymized mobile location data, and casino entry systems provide overlapping indicators that strengthen the observed relationships. A working paper from the University of British Columbia's Sauder School of Business examined three consecutive holiday periods and found that a single day of major rail cancellation produced attendance shortfalls that persisted for up to 48 hours after service resumed, suggesting that disrupted travelers often reschedule entire trips rather than adjust mid-journey.
What's interesting is how secondary effects compound the primary impact. When public transport delays increase, taxi and rideshare demand spikes, which raises costs and wait times for remaining travelers. Regional casino operators have noted that promotional offers tied to transport partnerships lose effectiveness during these windows because the underlying service reliability cannot be guaranteed.
Geographic and Demographic Variations
Attendance sensitivity varies by visitor demographics and distance traveled. Data from the New Zealand Ministry of Transport show that long-distance bus passengers contribute disproportionately to holiday attendance at venues on the North Island, while shorter-distance rail users demonstrate greater flexibility in rescheduling. Properties that draw from catchment areas exceeding 150 kilometers register larger percentage changes during service interruptions than those serving predominantly local populations.
Observers note that holiday periods also shift the composition of casino visitors toward leisure travelers rather than regular local patrons, increasing reliance on transport networks that may already operate near capacity. This demographic shift amplifies the visibility of any service failures in attendance statistics.
Conclusion
Transport performance metrics and casino attendance records together illustrate a clear linkage that operates across multiple regions and holiday cycles. Government agencies, academic researchers, and industry associations continue to refine data collection methods that capture these interactions with greater precision. As network modernization programs advance into 2026, ongoing monitoring will clarify how infrastructure reliability shapes visitor flows at regional gaming destinations during peak travel seasons.