19 Jun 2026
Weather Pattern Analysis Enhances Forecasting Accuracy for Outdoor Athletic Competitions

Atmospheric conditions play a decisive role in determining results across open-air sporting events, and analysts now trace historical weather data patterns to build more precise models for outcomes in tennis, golf, soccer, cricket and marathon competitions. Meteorologists combine decades of surface observations with satellite records to identify recurring trends such as wind corridors at coastal venues or humidity spikes during summer tournaments that alter ball flight, player endurance and match scheduling.
Data Sources and Collection Methods
National weather services maintain extensive archives that researchers access through standardized APIs, while private meteorological firms deploy dense networks of IoT sensors around stadium perimeters to capture micro-climate variations every minute. These datasets reveal how afternoon sea breezes at venues like those on the Australian coast shift from 5 km/h to 25 km/h within two hours, a pattern that directly influences serve percentages in tennis and swing rates in cricket. Studies conducted by institutions including the University Corporation for Atmospheric Research demonstrate that integrating radar-derived precipitation forecasts with historical dew-point readings reduces unexpected rain delays by measurable margins at major golf events.
Impact on Specific Sports
Track-and-field athletes encounter measurable performance shifts when temperatures cross 28 °C, with sprint times lengthening and endurance events showing higher dropout rates, according to longitudinal records compiled by Olympic data repositories. In soccer, high humidity combined with low wind speeds correlates with increased fatigue metrics tracked by GPS wearables, prompting coaching staffs to adjust substitution patterns based on real-time environmental inputs. Golf tournaments illustrate another layer: morning dew on fairways slows ball roll until solar radiation evaporates surface moisture, a daily cycle now modeled using radiation-balance equations fed by automated weather stations positioned at each hole.
Technological Integration and June 2026 Developments
Advanced algorithms process multi-variable inputs including barometric pressure trends, ultraviolet indices and soil temperature gradients to generate probability distributions for event postponements or record-setting conditions. European meteorological agencies and North American counterparts share standardized formats that allow seamless fusion of datasets across continents, enabling analysts to compare how similar pressure systems affect play in the UK Open versus the US Masters. Beginning in June 2026, upgraded satellite constellations will deliver higher-resolution moisture profiles over mid-latitude venues, supplying forecasters with five-minute temporal granularity that refines the timing of weather windows during multi-day competitions.
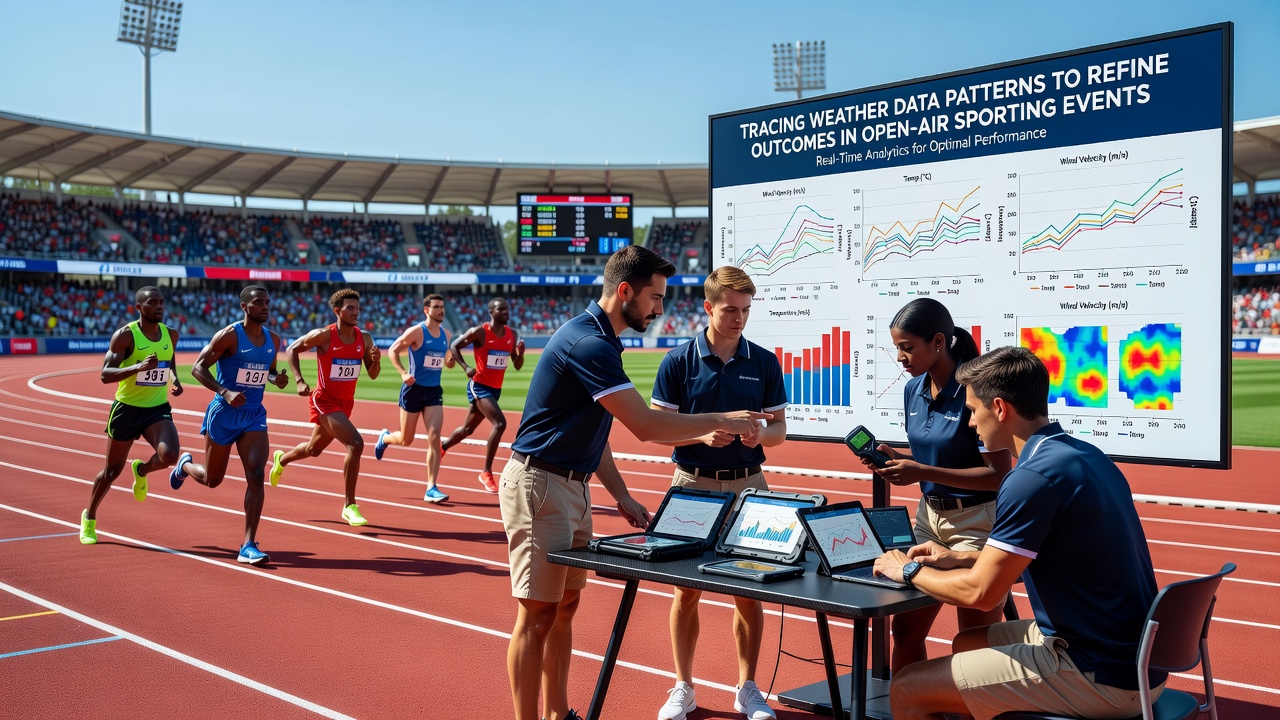
One study released by the Australian Bureau of Meteorology examined five years of cricket match data and found that tailwinds exceeding 15 km/h increased six-hitting frequency by 18 percent at certain grounds while simultaneously raising no-ball rates for seam bowlers. Marathon organizers in North America apply heat-stress indices derived from wet-bulb globe temperature readings to set start-time adjustments, a protocol refined through post-event analysis of runner split times against recorded conditions. These examples illustrate how granular environmental records translate into tactical adjustments rather than reactive decisions.
Predictive Modeling Approaches
Statistical frameworks now incorporate ensemble forecasting techniques that run dozens of simulations for each upcoming event, weighting outputs according to historical verification scores at that specific location. Machine-learning models trained on past tournament archives identify non-linear interactions, such as the combined effect of falling pressure and rising humidity on tennis ball bounce coefficients, patterns invisible in single-variable analysis. Industry reports from organizations tracking global sports logistics note that venues adopting these integrated systems report fewer weather-related cancellations and more consistent scheduling for broadcast partners.
Regional differences further shape modeling priorities: desert tournaments prioritize dust and temperature spikes, whereas northern European events emphasize persistent drizzle and low cloud ceilings that reduce visibility for officials and spectators alike. Cross-referencing ground-level observations with upper-air soundings allows forecasters to anticipate when a stable high-pressure ridge will suppress convective activity or when an approaching front will generate sudden gusts capable of altering trajectory sports like archery or golf.
Conclusion
Continuous refinement of weather-data pipelines supplies event organizers, broadcasters and performance analysts with actionable probabilities that improve planning accuracy across open-air disciplines. As sensor density increases and computational methods evolve, the resolution of these environmental forecasts continues to rise, delivering clearer distinctions between routine variability and record-altering conditions at stadiums worldwide.