2 Aug 2026
Weather Patterns and Their Impact on Greyhound Trap Selections in Modern Racing
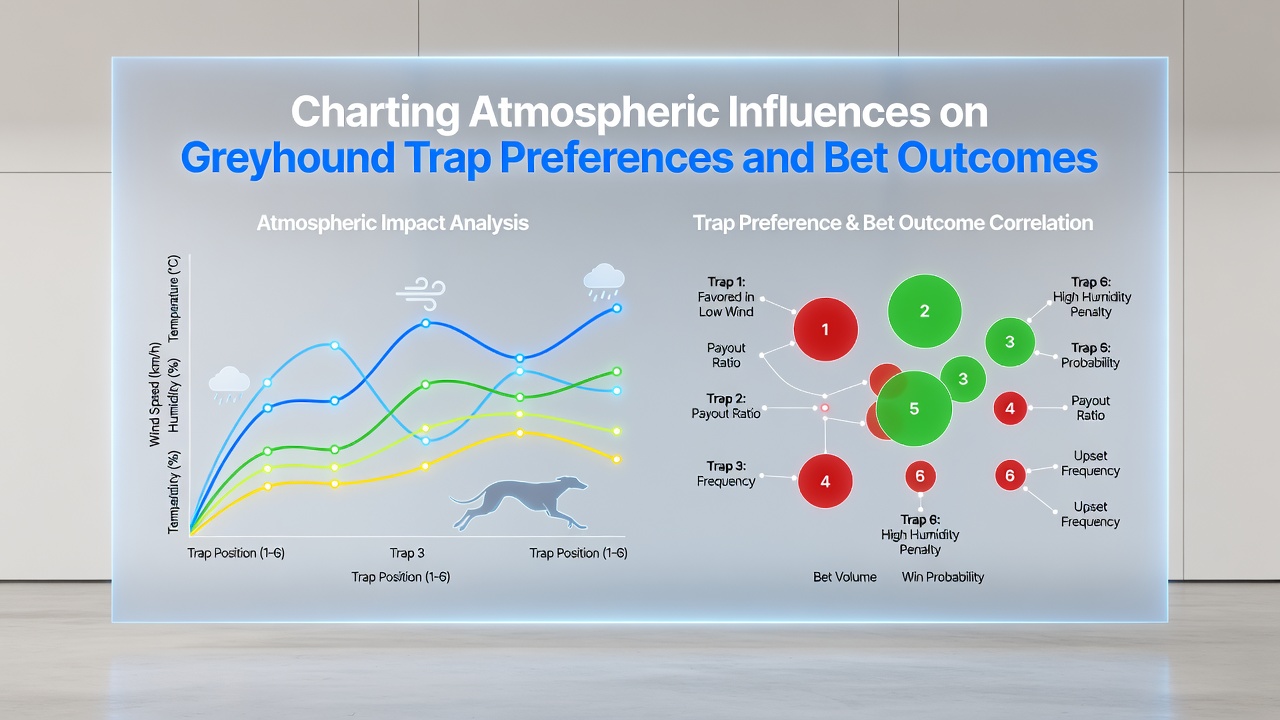
Atmospheric conditions shape greyhound performance across trap positions in ways that data analysts track closely throughout the racing calendar, and researchers have mapped correlations between temperature shifts, humidity levels, wind direction, and the success rates of inside versus outside traps at various venues.
Temperature Variations and Trap Dynamics
Lower temperatures often tighten muscle responses in greyhounds, which leads observers to note stronger breaks from traps one through three where shorter distances to the first bend reduce exposure to cooler air, while data collected across multiple seasons shows outside traps experiencing delayed acceleration when mercury drops below eight degrees Celsius. Humidity compounds these effects because higher moisture content in the air alters oxygen intake during the initial sprint, and studies from animal performance labs indicate that dogs in trap four and beyond lose up to three percent in early speed when relative humidity exceeds seventy percent on race day.
Wind Influence on Track Surfaces
Crosswinds create uneven sand distribution along the bends, and this pushes racing lines outward so that greyhounds drawn into traps five and six encounter looser footing on teh home straight, whereas headwinds hitting the back straight slow momentum for inside runners who must fight the gusts longer. Data from automated timing systems reveal that tailwinds favor traps two and three by maintaining higher average speeds through the final two hundred meters, and meteorologists working with racing statisticians have documented these patterns at tracks where prevailing winds align with the straight sections.
Barometric pressure changes also register in performance logs because falling pressure ahead of weather fronts correlates with reduced stamina in longer sprint races, and analysts record higher win percentages for trap one runners when pressure falls more than five millibars in the twenty-four hours before post time.
Recent Data Trends Through August 2026
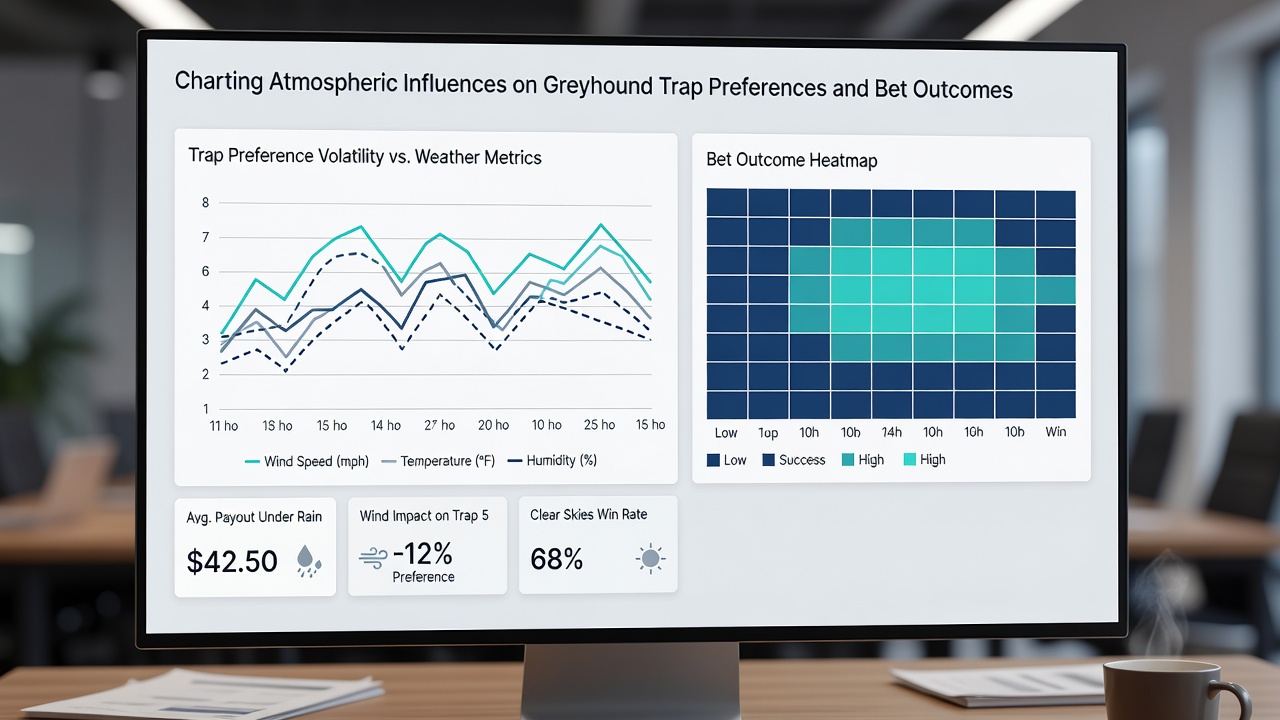
Figures compiled through August 2026 by international racing data hubs show consistent regional differences, and analysts note that tracks in drier climates experience fewer trap preference swings during temperature swings compared with coastal venues where humidity fluctuates rapidly. One study released by the University of Melbourne's equine and canine research group linked specific pressure drops to a measurable shift toward inside trap success, while parallel findings from the National Oceanic and Atmospheric Administration highlight how wind vector changes alter track bias at American venues that share similar surface compositions.
Those patterns extend into betting markets because oddsmakers adjust trap-based probabilities when forecasts predict strong winds or temperature drops, and bettors who review historical weather overlays alongside trap statistics identify edges in races where atmospheric forecasts align with established preferences. Research indicates that combining surface temperature readings taken two hours before the first race with wind speed data improves prediction models for trap outcomes by measurable margins across sample sizes exceeding five thousand races.
Integrating Atmospheric Data into Outcome Analysis
Track maintenance crews adjust watering schedules in response to humidity readings, and this produces firmer or softer going that further amplifies or dampens trap advantages depending on the direction of prevailing winds. Observers note that when rain coincides with falling pressure, inside traps maintain their edge because the rail position offers the most consistent surface, whereas outside traps suffer from spray and variable moisture that slows wider runners.
Statistical models built from these variables allow analysts to generate trap probability matrices that update in real time as weather stations feed new readings, and several racing jurisdictions now publish supplementary data sheets that include atmospheric summaries alongside standard form guides. These resources help explain why certain trap biases persist at specific tracks even when the competing greyhounds show similar recent form lines.
Conclusion
Atmospheric charting continues to refine the understanding of trap preferences and resulting bet outcomes because integrated weather and performance datasets grow more granular each season. Racing authorities and independent researchers maintain ongoing collection programs that link pressure, wind, temperature, and humidity directly to trap-specific results, and these records provide the foundation for updated analytical tools used across international greyhound circuits.